FreeWebCheck
How to Test Website Speed and Performance
A client told me their homepage took eight seconds to load. I ran a speed test, and the report showed a single uncompressed hero image (4.8 MB) was responsible for 60% of the page weight. After resizing it to 1920px and converting to WebP, load time dropped to 2.4 seconds. One change, three lines of work, and the page went from “abandon me” to “usable.”
Site speed isn’t a nice-to-have anymore. Google uses it as a ranking factor for both desktop and mobile. Visitors bounce if a page takes over three seconds — and each lost second cuts conversions by roughly 2-3% depending on the industry. Here’s how to test your site speed, make sense of the numbers, and fix what matters.
What a Speed Test Actually Measures
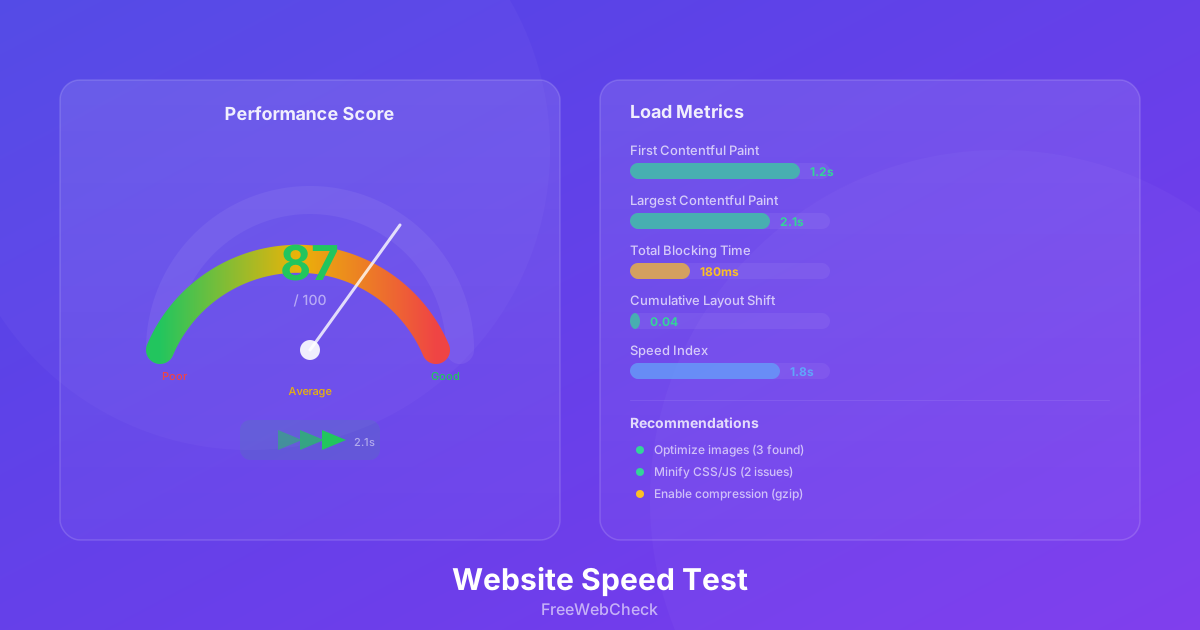
Most speed tools report a set of standardized metrics defined by Google’s Lighthouse and the Web Vitals initiative. These aren’t arbitrary numbers — they map directly to what a real user experiences.
- First Contentful Paint (FCP) — When the first bit of text or image shows up. Under 1.8 seconds is good.
- Largest Contentful Paint (LCP) — When the main content is visible. Aim for under 2.5 seconds.
- Total Blocking Time (TBT) — How long JavaScript blocks the main thread. Under 200ms is the goal.
- Cumulative Layout Shift (CLS) — Measures unexpected layout jumps. Keep it below 0.1.
A “good” score doesn’t mean all metrics are green. I’ve seen pages with a 95 score still have an LCP over 3 seconds because a slow third-party script was dragging things down. Look at the detailed breakdown, not just the aggregate.
The Tools I Use
You can run these entirely in your browser — no installs, no sign-ups.
FreeWebCheck Website Audit — Enter a URL and get a full Lighthouse report with scores, load metrics, and prioritized fixes. It highlights render-blocking resources, oversized images, and missing compression.
FreeWebCheck Image Toolkit — Most speed issues are image-related. Drop your images in here to resize, compress, and convert to WebP without uploading to any server.
DNS Lookup — Slow DNS resolution adds 100-500ms before a single byte loads. Check your DNS response times — if they’re high, consider switching to a faster provider like Cloudflare or Google.
Lighthouse (built into Chrome DevTools) is also excellent for deep dives. Run it from the Audits panel and inspect every request in the network waterfall.
How to Run a Test (And Not Misread the Results)
Many people run one test, see a score, and move on. That’s a mistake. Network conditions vary, and single runs have high variance.
Run three tests at different times of day and take the median. Use an incognito window to avoid extension interference. Test both desktop and mobile — mobile scores are often lower because of slower CPUs and network throttling. I’ve found mobile tests reveal issues (like huge JavaScript bundles) that barely register on a desktop test.
Repeat after opening the page with a cold cache. A cached page loads faster, but real users arrive cold.
Common Bottlenecks and How to Fix Them
Images. Still the top offender. Resize to the display dimensions (not the 4000px your camera shot). Compress to quality 80. Convert to WebP. The Image Toolkit handles all three at once.
JavaScript. Render-blocking scripts delay FCP and LCP. Defer non-critical scripts with the defer or async attribute. If you’re loading analytics, a chatbot widget, and three ad networks, consider whether each is actually needed.
Fonts. Custom fonts often add 200-400ms to load time. Use font-display: swap so text remains visible during load. Self-host your fonts instead of loading from Google Fonts — that cuts a DNS lookup and a connection.
Server response time. If Time to First Byte (TTFB) is over 600ms, your hosting is the bottleneck. A DNS Lookup can tell you if resolution is slow. Consider a CDN or faster host.
Quick Checklist
Before declaring your site “fast enough,” run through this:
- Run a speed test and check FCP, LCP, TBT, and CLS
- Test on mobile (not just desktop)
- Compress and resize all images above 200 KB
- Defer non-critical JavaScript
- Enable text compression (gzip or brotli)
- Set
font-display: swapon custom fonts - Check TTFB — if over 600ms, investigate hosting
- Test with a cold cache, in incognito
One thing to keep in mind: a perfect score isn’t always possible, and chasing it can be a trap. You can spend days shaving 50ms off a page that nobody notices. Focus on the bottlenecks that actually move the needle — oversized images, render-blocking scripts, and slow server response — and stop once the user experience feels fast. A site that loads in 2.5 seconds with an 85 score is better than one that takes a week of optimization to hit 98.
Running a speed test takes about a minute. The fixes for the biggest issues take another ten. If you haven’t checked your site lately, start now.